Linksys Velop WRT Pro 7 のメトリックスを Amazon CloudWatch で可視化する
自宅の無線ルーターである Linksys Velop WRT Pro 7 は、OpenWrt ベースのファームウェアが載っている。OpenWrt には Prometheus 形式でメトリックスを公開する prometheus-node-exporter-lua パッケージがあるので、これを使ってメトリックスを CloudWatch に送り、ダッシュボードを作ってみた。
構成図 #
構成は次のようになっている。
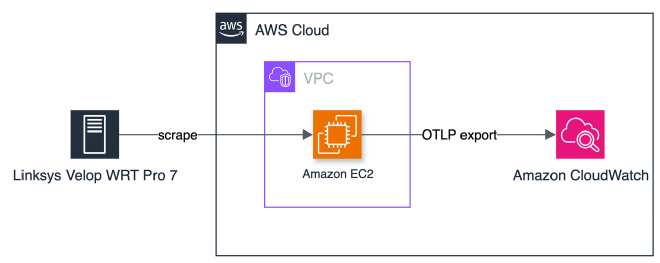
IAM ユーザーのアクセスキーは管理したくなかったので、IAM ロールを使える EC2 でメトリックスを収集し、CloudWatch へ送ることにした。EC2 では OpenTelemetry Collector が動いていて、ルーターから scrape したメトリックスを OTLP で CloudWatch にエクスポートしている。なお、EC2 からルーターへ到達できるよう、両者は Tailscale でつないでいる。
Linksys Velop WRT Pro 7 に必要なパッケージをインストール #
ダッシュボードはOpenWRT - Grafana Dashboardを参考に作成したかったので、次のパッケージをインストールしてみた。
- prometheus-node-exporter-lua
- prometheus-node-exporter-lua-nat_traffic
- prometheus-node-exporter-lua-netstat
- prometheus-node-exporter-lua-openwrt
- prometheus-node-exporter-lua-wifi
- prometheus-node-exporter-lua-wifi_stations
検証を進めた結果、prometheus-node-exporter-lua-wifi_stations は Linksys Velop WRT Pro 7 では動作しないこと、prometheus-node-exporter-lua-nat_traffic と prometheus-node-exporter-lua-wifi で取得できるメトリックスは今回のダッシュボードには不要なことがわかったので、この 3 つは最終的にインストールしないことにした。
prometheus-node-exporter-lua-wifi_stations が Linksys Velop WRT Pro 7 で使えない理由 #
prometheus-node-exporter-lua-wifi_stations は、ubus でインターフェース一覧を取得し、iwinfo のassoclist()でステーション一覧を取得している。しかし Linksys Velop WRT Pro 7 の無線ドライバーである qcawificfg80211 は netifd に登録されていないので、ubus の結果は常に空になり、assoclist()も常に nil を返す。
そこで、インターフェースごとの hostapd 制御ソケットにhostapd_cliで直接問い合わせ、ステーションの signal・inactive time・tx/rx カウンターなどを取得する collector を自作した。次のファイルを/usr/lib/lua/prometheus-collectors/wifi_stations.luaに配置している。
-- The Linksys Velop WRT Pro 7 cannot use prometheus-node-exporter-lua-wifi_stations:
-- its interface discovery (`ubus call network.wireless status`) always returns
-- {} because this firmware's wifi-device type ("qcawificfg80211", QCA/QSDK) is
-- never registered with netifd's wireless subsystem, and even with interfaces
-- read from UCI instead, iwinfo's assoclist() always returns nil for that
-- device type, so no per-station data is available through iwinfo.
--
-- This collector instead shells out to hostapd_cli, which talks to the
-- per-radio hostapd control socket at /var/run/hostapd-<device>/<ifname>
-- and returns real station stats (signal, inactive time, tx/rx counters)
-- regardless of the iwinfo/ubus limitation.
--
-- Do not `opkg install prometheus-node-exporter-lua-wifi_stations` -- it
-- will overwrite this file with the non-functional upstream version.

local uci = require("uci")

local cursor = uci.cursor()

local function gauge(name)
 return metric(name, "gauge")
end

local function counter(name)
 return metric(name, "counter")
end

local metric_wifi_stations = gauge("wifi_stations")
local station_metrics = {
 { field = "signal", metric = gauge("wifi_station_signal_dbm") },
 { field = "inactive_msec", metric = gauge("wifi_station_inactive_milliseconds") },
 { field = "tx_packets", metric = counter("wifi_station_transmit_packets_total") },
 { field = "rx_packets", metric = counter("wifi_station_receive_packets_total") },
 { field = "tx_bytes", metric = counter("wifi_station_transmit_bytes_total") },
 { field = "rx_bytes", metric = counter("wifi_station_receive_bytes_total") },
}

-- hostapd_cli's `all_sta` output is a flat station MAC address line
-- followed by its "key=value" attribute lines, repeated per station. If
-- hostapd_cli can't reach the control socket, it prints an error line
-- instead (e.g. "Failed to connect to hostapd - ..."); the MAC check below
-- keeps that from being mistaken for a station.
local function parse_stations(output)
 local stations = {}
 local current
 for line in output:gmatch("[^\n]+") do
  local key, value = line:match("^(%w[%w_]*)=(.*)$")
  if key and current then
   current[key] = value
  elseif line:match("^%x%x:%x%x:%x%x:%x%x:%x%x:%x%x$") then
   current = {}
   stations[line] = current
  else
   current = nil
  end
 end
 return stations
end

local function scrape()
 -- Interfaces are independent hostapd control sockets, so every
 -- `hostapd_cli` process is started before any of them are read back --
 -- the wait time is bounded by the slowest socket instead of their sum.
 local procs = {}
 cursor:foreach("wireless", "wifi-iface", function(section)
  local ifname = section.ifname
  local device = section.device
  if not ifname or not device then
   return
  end

  local proc =
   io.popen(string.format("hostapd_cli -p '/var/run/hostapd-%s' -i '%s' all_sta 2>/dev/null", device, ifname))
  if proc then
   procs[#procs + 1] = { ifname = ifname, proc = proc }
  end
 end)

 for _, p in ipairs(procs) do
  local output = p.proc:read("*a")
  p.proc:close()

  local count = 0
  for mac, sta in pairs(parse_stations(output)) do
   count = count + 1
   local labels = { ifname = p.ifname, mac = mac }

   for _, sm in ipairs(station_metrics) do
    local value = sta[sm.field]
    if value then
     sm.metric(labels, tonumber(value))
    end
   end
  end

  metric_wifi_stations({ ifname = p.ifname }, count)
 end
end

return { scrape = scrape }
EC2 の設定 #
EC2 では OpenTelemetry Collector を動かし、メトリックスの収集と CloudWatch への送信をしている。設定ファイルは次のとおり。
receivers:
  prometheus:
    config:
      scrape_configs:
        - job_name: openwrt
          scrape_interval: 60s
          static_configs:
            - targets:
                - openwrt:9100

processors:
  transform:
    error_mode: ignore
    metric_statements:
      - context: metric
        statements:
          - convert_sum_to_gauge() where metric.name == "node_time_seconds"
  cumulativetodelta: {}
  batch:
    send_batch_size: 200
    timeout: 10s

exporters:
  otlphttp:
    metrics_endpoint: https://monitoring.ap-northeast-1.amazonaws.com/v1/metrics
    auth:
      authenticator: sigv4auth

extensions:
  sigv4auth:
    region: ap-northeast-1
    service: monitoring

service:
  extensions:
    - sigv4auth
  pipelines:
    metrics:
      receivers:
        - prometheus
      processors:
        - transform
        - cumulativetodelta
        - batch
      exporters:
        - otlphttp
cumulativetodelta processor で counter の累積値を差分に変換している。各データポイントが 60 秒間の増分になるので、ダッシュボードではavg_over_time(...[5m]) / 60で毎秒の値を、sum_over_time(...[24h])で 1 日の合計を求められる。ただし、node_time_secondsは counter として公開されているものの中身は現在時刻で、稼働時間の計算に使うので、差分に変換されないよう、事前にtransformで gauge に変換している。
ダッシュボード #
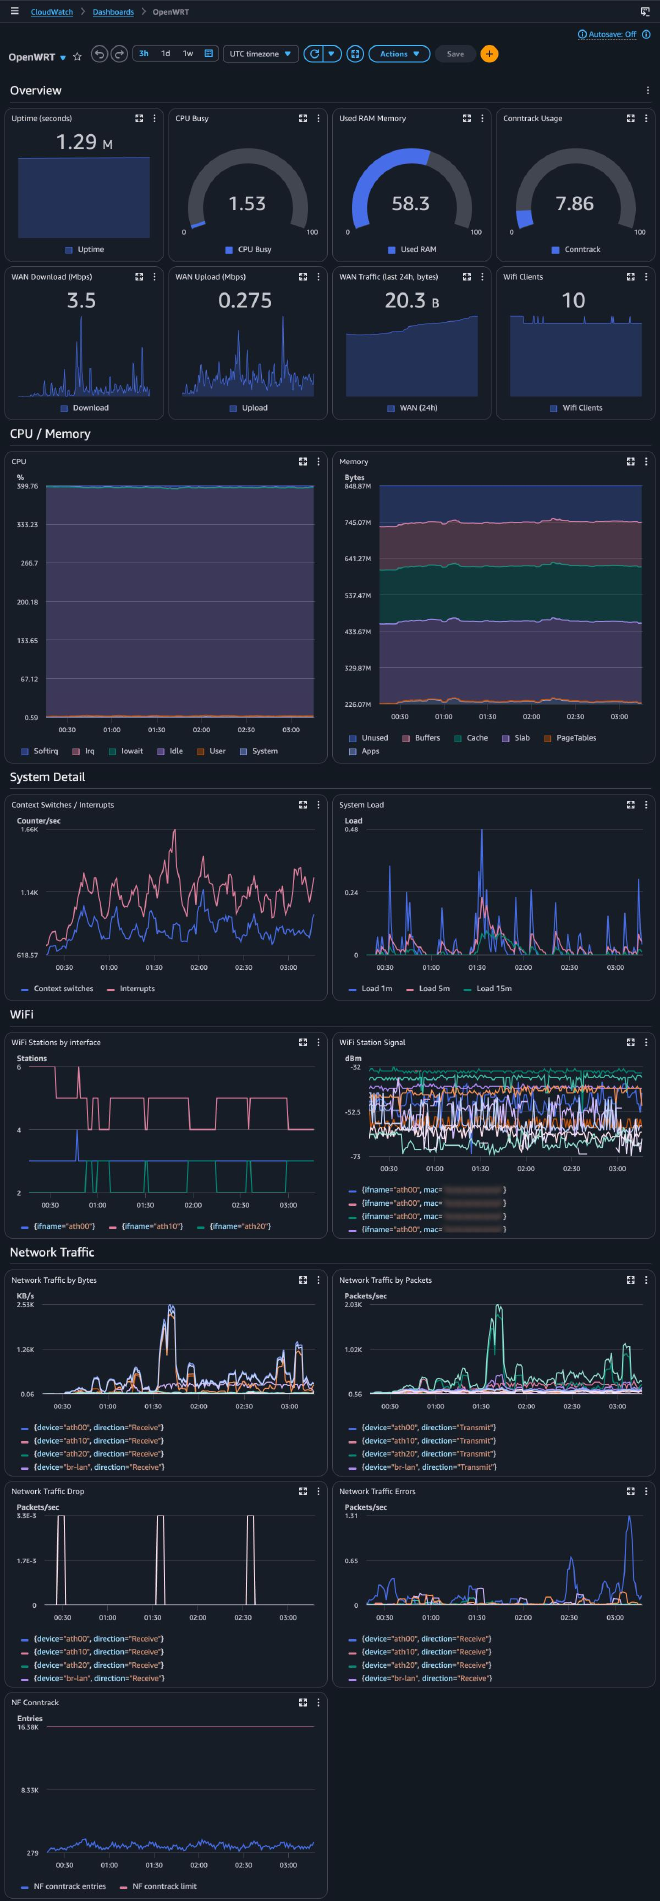
参考にした OpenWRT - Grafana Dashboard には不要なパネルが多かったので、調整して次のようなダッシュボードを作成した。